Set up monitoring alerts
Turn on alerts so super admins hear about failed background jobs and sign-in lockouts, add email recipients, and connect Sentry error monitoring.
- Applies to
- Core 12.0 and later
- Who can do this
- Platform owner
- Permission
feature.core. monitoring.edit - Where
- Configurations › Utilities › Monitoring Settings
On this page
Before you start
- You need to be a super admin, or hold
feature.. The monitoring permissions aren't part of the standard Administrator role.core. monitoring.edit - Alerts are checked every five minutes by your Laramin's scheduled jobs. Check on Developer Tools › Scheduler that jobs have a recent Last Run. Otherwise no alerts are checked; see Scheduled jobs don't run.
- For Sentry, have your project's DSN ready.
What raises an alert
- Failed background jobs. The number of failed queue jobs reaches Failed-jobs alert threshold.
- Sign-in lockouts. Repeated failed sign-ins lock out an email address or a username. The alert names the identifier and the IP address.
Every alert goes to all super admins as an in-app notification. It's also written to the security log, and emailed to any addresses you add.
Steps
-
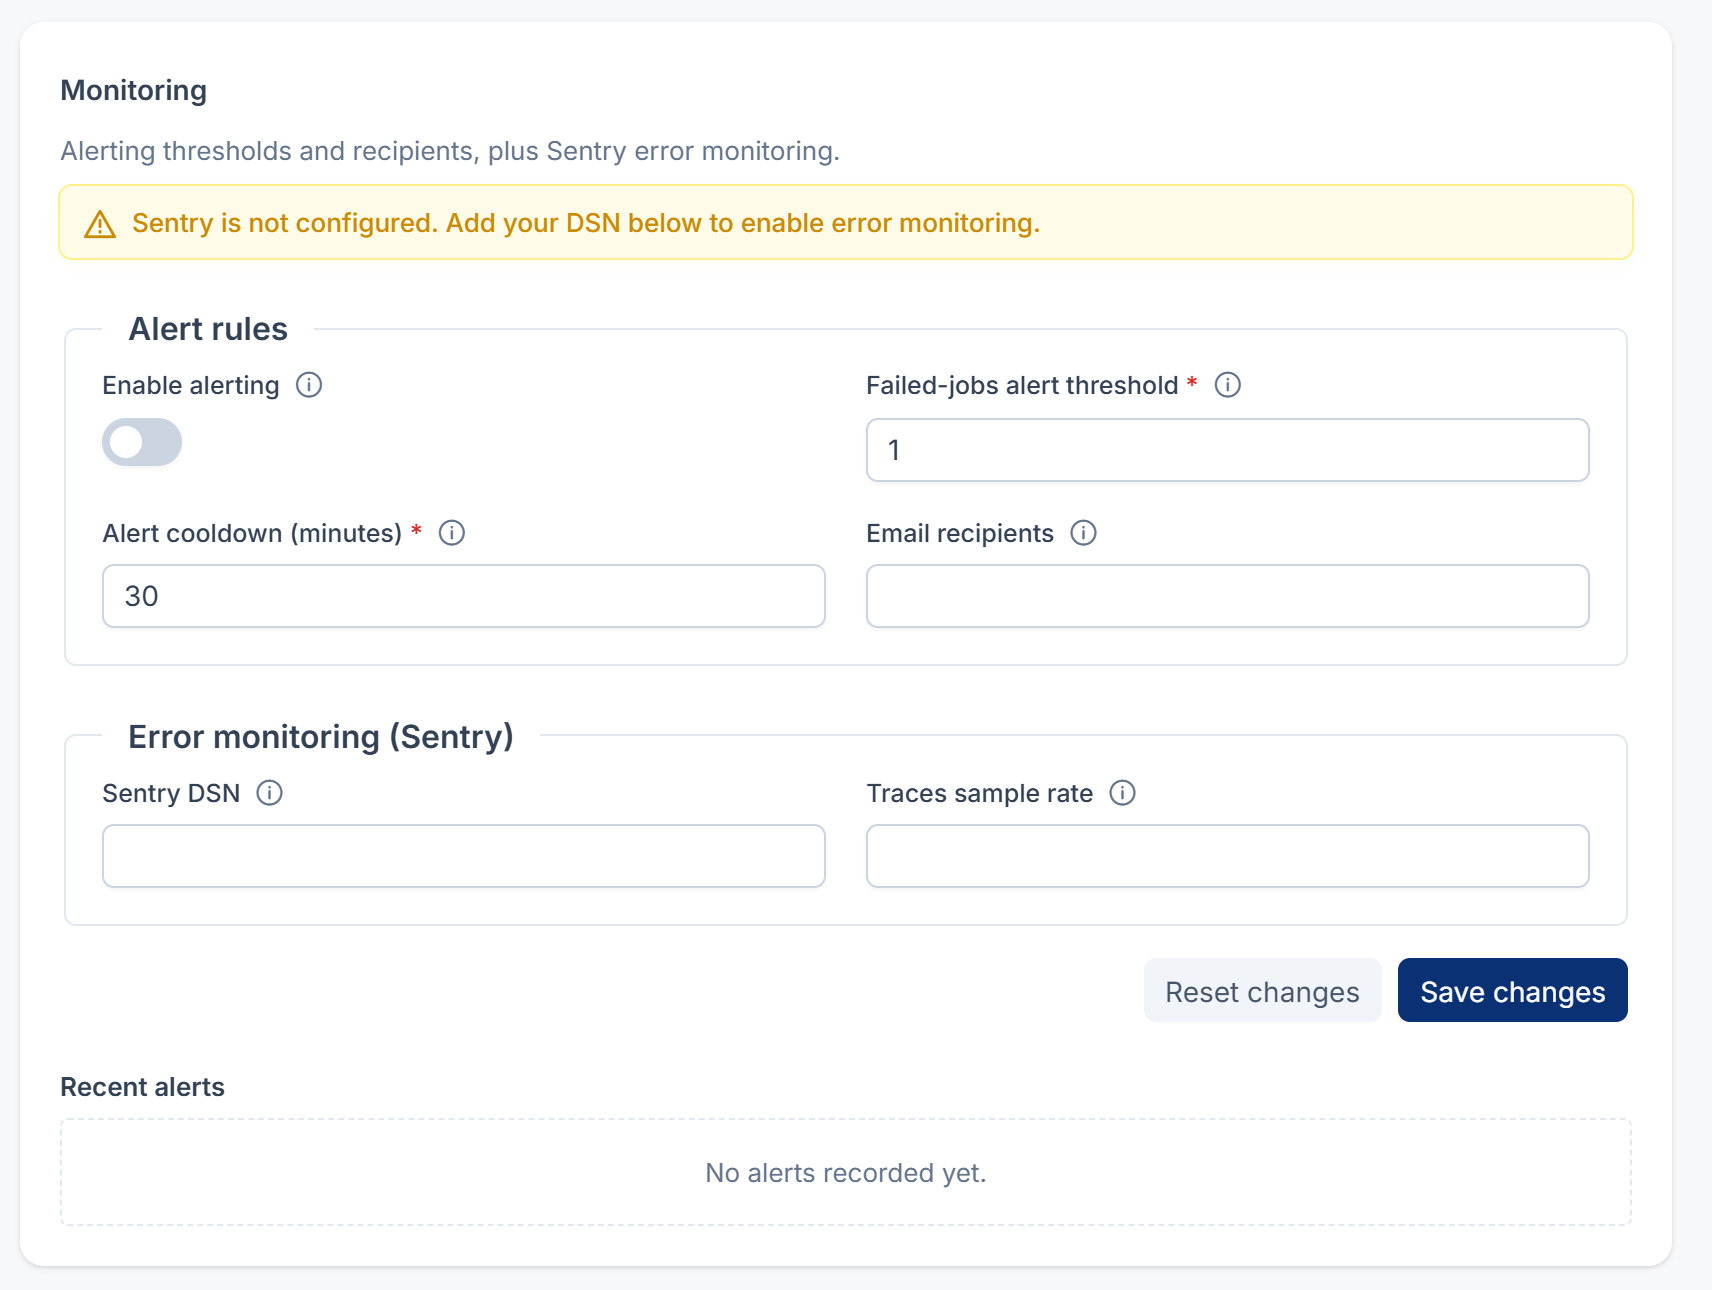
In the sidebar, open Configurations › Utilities › Monitoring Settings.
-
Under Alert rules, turn on Enable alerting. While it's off, no alerts are checked or sent.
-
In Failed-jobs alert threshold, enter the number of failed jobs that should raise an alert. The default and recommended value is 1. You can enter 1–1000.
-
In Alert cooldown (minutes), enter the shortest gap between two copies of the same alert. The default is 30. Enter 0 to send every alert, even repeats.
-
In Email recipients, enter any extra addresses to email, separated by commas. Super admins get the in-app alert whether or not you list them.
-
To connect Sentry, under Error monitoring (Sentry), enter Sentry DSN. Leave it empty to turn Sentry off.
-
Optionally, in Traces sample rate, enter the share of transactions Sentry should capture, from 0.0 to 1.0. Leave it empty to use Sentry's default.
-
Select Save changes.
What happens next
- The banner at the top of the panel says whether Sentry is configured: Sentry is configured — exceptions are being captured. or Sentry is not configured. Add your DSN below to enable error monitoring.
- Recent alerts, at the bottom of the panel, lists up to 30 of the newest alerts from the security log, newest first. It reads the last seven daily log files, so older alerts drop off. Until something fires, it shows No alerts recorded yet.
- When a failed job is retried or flushed, the failed-jobs count drops. You can do that from Queue & Worker Status in Extra Utilities.
Thanks. That helps us decide what to write next.
Thanks for telling us what was missing.
You already answered for this article today. Thanks.
We got a lot of answers from your network just now. Try again in a few minutes.
We couldn't send that. Check your connection and try again.
Links in this article
Printed from help.bsscn.com. The online article may have changed since.