Review test submissions and analytics
See every learner's attempts at your mock tests, open one attempt's score, timings and charts, read how each answer was classified, and delete an attempt to give it back.
- Applies to
- Question Bank 3.5 and later
- Who can do this
- Administrator, Team member
- Permission
feature.qb. test_submission.list - Where
- Question Bank › Test Submissions
On this page
Before you start
- You need List Test Submissions (
feature.) to see the list, and View Test Submission Details (qb. test_submission.list feature.) to open an attempt.qb. test_submission.view - In Question Bank 3.5.2 no new attempts are recorded, because learners can't take a test. The list shows attempts made before 3.4.0, and demo data on demo installations.
Find an attempt
-
In the sidebar, open Question Bank › Test Submissions.
-
Each row is one attempt:
- Mock Test: the test.
- Status: Completed, In Progress (not yet submitted) or Cancelled.
- Revision: which attempt it was for that learner, such as
Rev 2. - Started: the learner and when they started.
- Test Result: questions attempted out of the total, correct, wrong, accuracy, total time and average time per question.
-
Filter by Mock Test or Status to narrow the list. See Filter a list.
Open an attempt's analytics
-
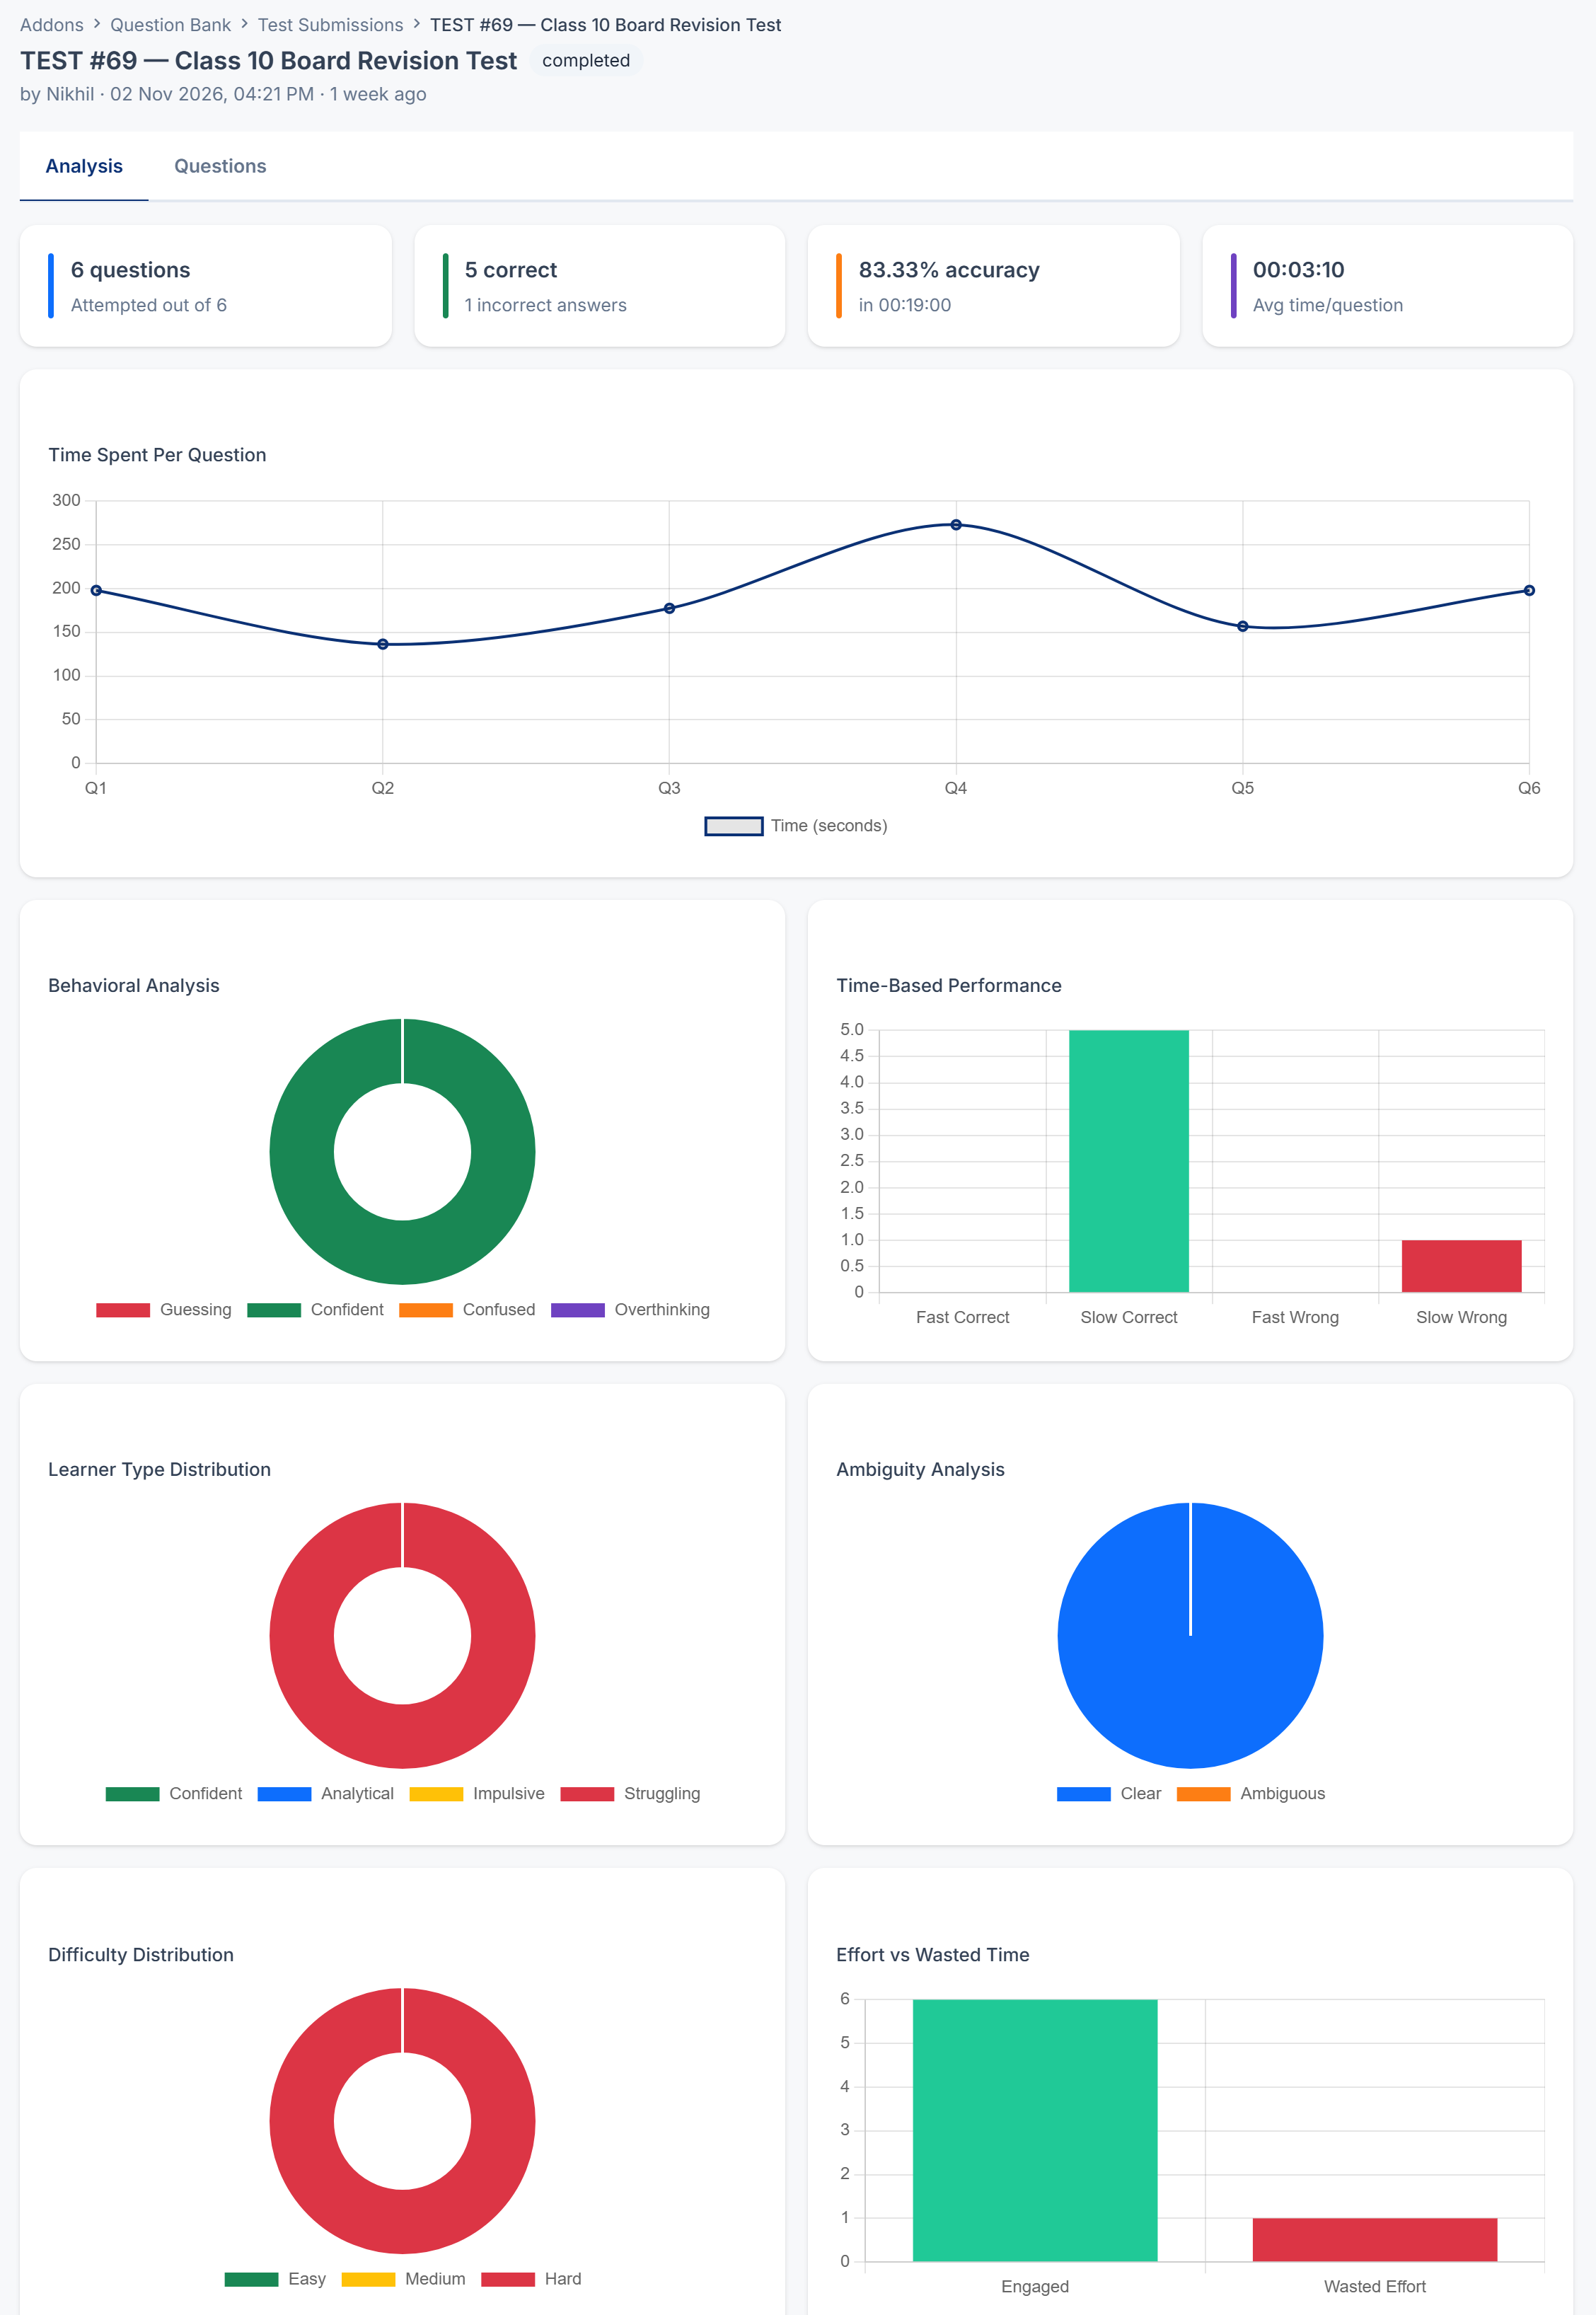
Select Analytics on the row. The page is titled with the attempt's number and the test, such as TEST #12, with the learner's name and the start time below.
-
The Analysis tab shows:
- Four cards: questions attempted out of the total, correct answers (with the number of incorrect ones), accuracy (with the total time), and the average time per question.
- Time Spent Per Question: a line chart of the seconds the learner spent on each question, in order.
- Six charts that classify each answered question (see below).
-
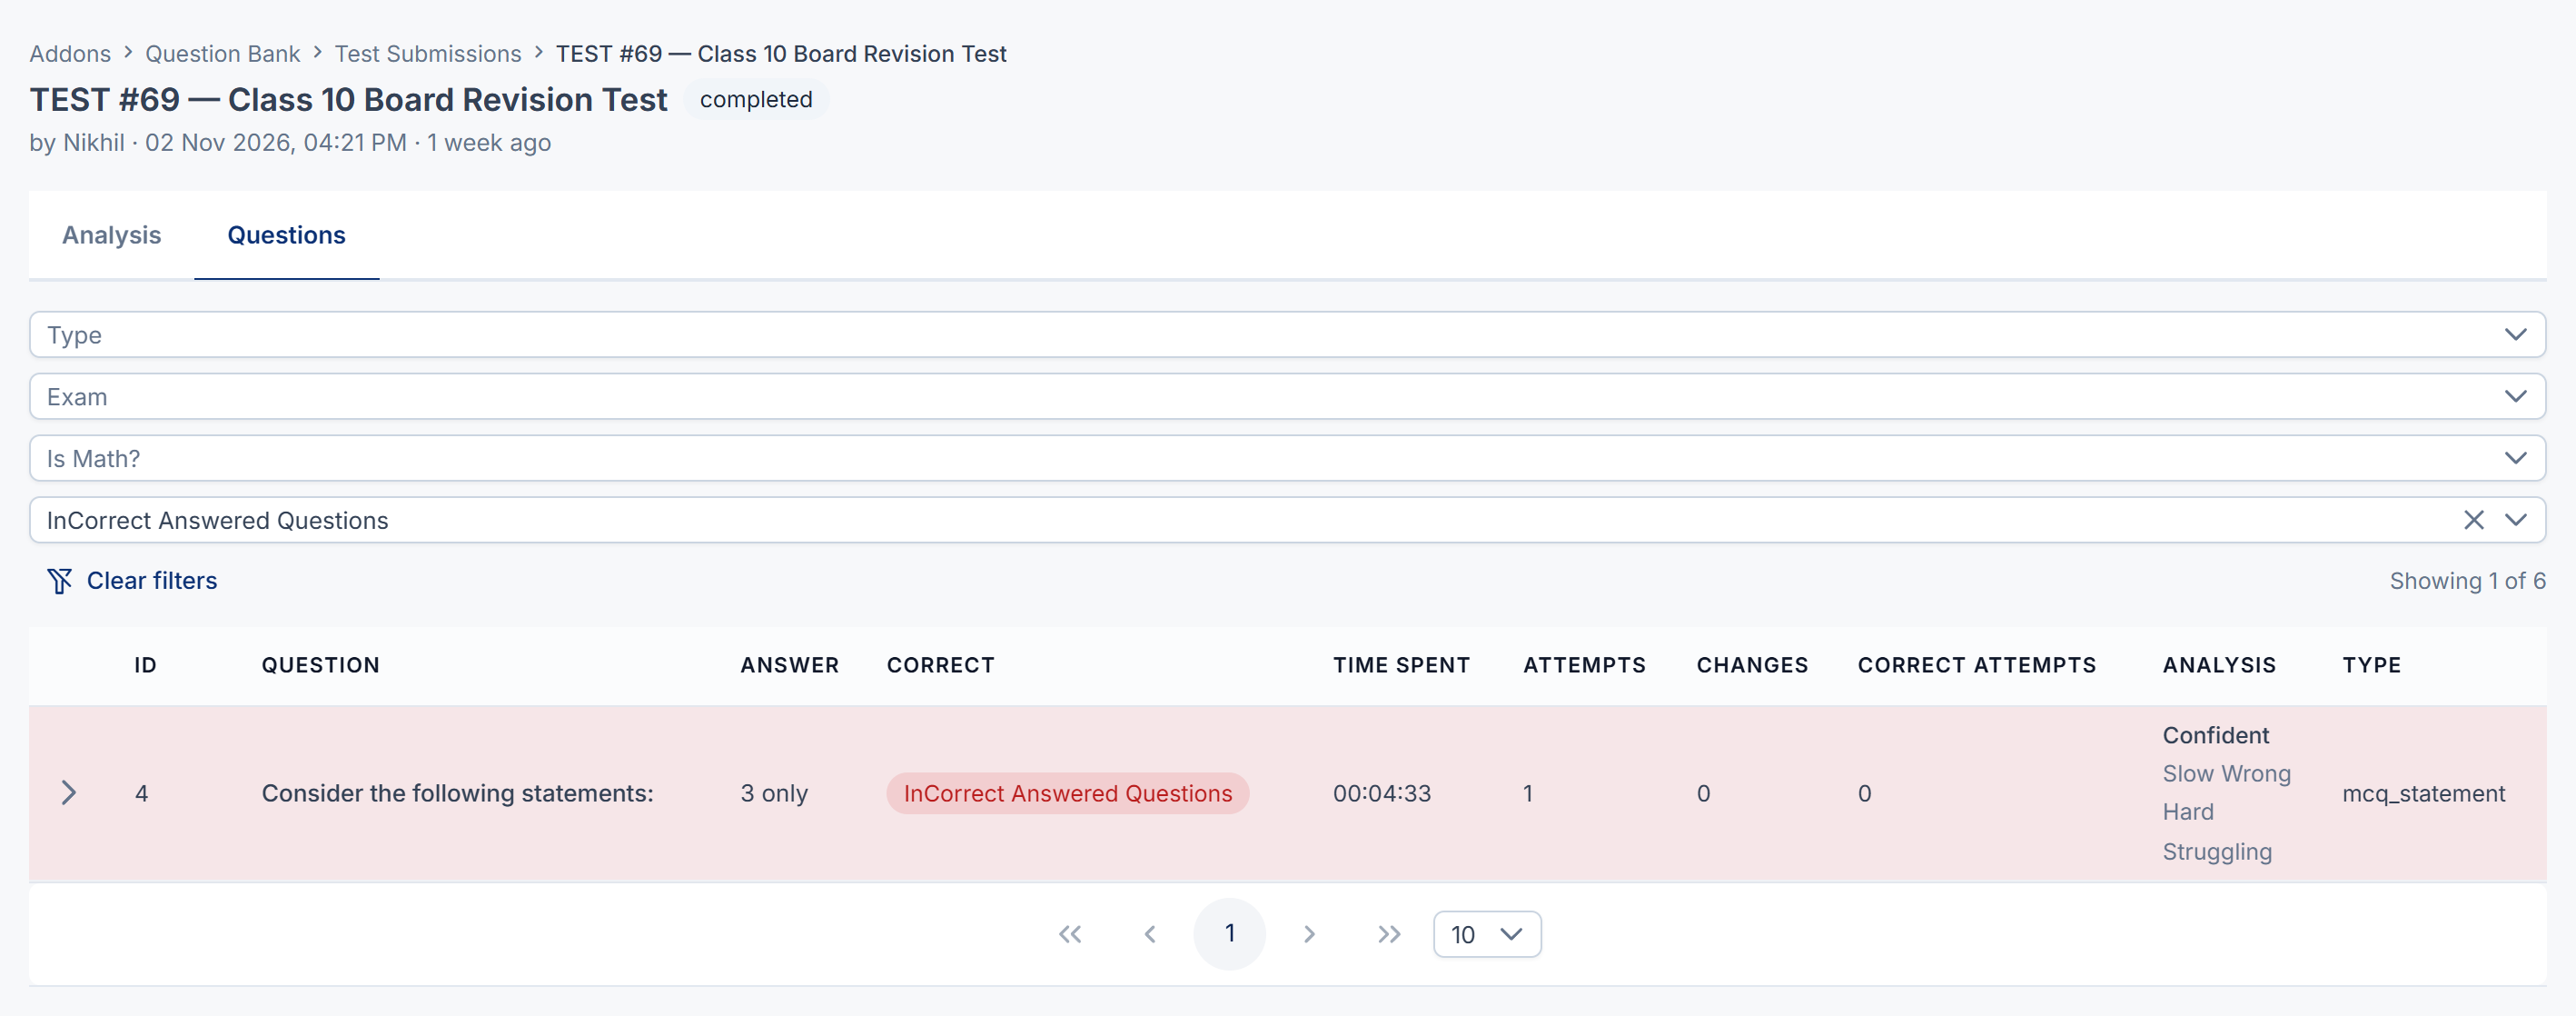
The Questions tab lists every question with the learner's Answer, whether it was Correct, Time Spent, Attempts (how many times they answered it), Changes (how often they changed their answer), Correct Attempts, the Analysis and the Type. Filter it by Type, Exam, Is Math? or Correct (Correct Answered Questions, InCorrect Answered Questions or Not Answered Questions). Select Clear filters to see them all again.
Accuracy is the share of attempted questions answered correctly. Averages are over all the test's questions.
What the charts mean
Each answered question is put in one group of each chart, from how long the learner spent on it, how often they answered and changed it, and whether they got it right. Unanswered questions aren't counted. "Fast" means 15 seconds or less; "slow" means 60 seconds or more.
| Chart | Groups |
|---|---|
| Behavioral Analysis | Overthinking: had it right at some point, but finished wrong. Confused: changed the answer two or more times. Guessing: answered more than once without ever being right. Confident: none of these. |
| Time-Based Performance | Fast Correct, Slow Correct, Fast Wrong and Slow Wrong. |
| Learner Type Distribution | Confident: right, fast, first try. Analytical: right in 15 to 60 seconds. Impulsive: wrong, fast, after two or more tries. Struggling: anything else. |
| Ambiguity Analysis | Ambiguous: changed two or more times and slow. Clear: the rest. A question many learners find ambiguous may be badly worded. |
| Difficulty Distribution | Easy: right, fast, first try. Medium: right within 60 seconds. Hard: anything else. |
| Effort vs Wasted Time | Engaged: answered more than once, or spent 30 seconds or more. Wasted Effort: slow and wrong. |
Two things to know when reading them:
- A correct answer given in more than 15 but less than 60 seconds is counted as Slow Wrong in Time-Based Performance. This is a known gap in how that chart groups answers, kept so existing figures don't move.
- When a test has Expose Answer off, the learner is never told they were right while answering, so Correct Attempts stays at 0 and Overthinking never appears.
These groups are for you: a learner's own result never shows them. In this version learners' result pages open empty, so learners only learn how they did from you. See See your tests and results.
Delete an attempt
Select Delete on the row, or select several rows and choose Delete from the bulk actions, and confirm. You need Soft Delete Test Submission (feature.). Soft Delete Own Test Submission Only covers only attempts you made yourself.
A deleted attempt no longer counts towards their No. of Revisions, so they get that attempt back. You can restore it from the Trashed view. Deleting a test's attempts is also how you make the test deletable. See Delete, restore and act on records in bulk.
What happens next
Thanks. That helps us decide what to write next.
Thanks for telling us what was missing.
You already answered for this article today. Thanks.
We got a lot of answers from your network just now. Try again in a few minutes.
We couldn't send that. Check your connection and try again.
Links in this article
Printed from help.bsscn.com. The online article may have changed since.